Install Zabbix Using Docker Compose
This article is for those looking for a detailed and straightforward guide on installing Zabbix using Docker Compose.
Zabbix is a mature and effortless enterprise-class open source monitoring solution for network monitoring and application monitoring of millions of metrics.
💾 You can find the repository used in this guide on GitHub.
We’ll use Traefik as our reverse proxy. It’ll handle obtaining cryptographic certificates from Let’s Encrypt for your domain names and route requests to the corresponding services based on those domains.
❗ To obtain cryptographic certificates, you will need A-type records in the external DNS zone, which point to the IP address of your server where Traefik is installed. If you have created these records recently, you should wait before starting the installation of the services. Full replication of these records between DNS servers can take from a few minutes to 48 hours or even longer in rare cases.
In this guide, we will consider the case where you already have a server with Ubuntu Server 22.04 LTS installed on it.
You can find detailed information on how to install Ubuntu Server 22.04 LTS in my guide “Install Ubuntu Server 22.04 LTS”.
Docker Engine and Docker Compose must also be installed on the server.
You can learn how to install Docker Engine on Ubuntu Server by reading Install Docker Engine and Docker Compose on Ubuntu Server”.
In addition, OpenSSH must be installed on the server, and port 22 must be open in order to be able to connect to the server using the SSH protocol.
To install OpenSSH on the server you can use the command:
sudo apt install openssh-serverIf you plan to connect to the server using the Windows operating system, you can use PuTTY or MobaXterm.
This guide covers connecting to the server using the terminal emulator iTerm2, installed on the macOS operating system.
💡 Please note, you will need to open the following TCP ports for access to the services:
- TCP port 80 - to obtain a free cryptographic certificate through the Let’s Encrypt certification center.
- TCP port 443 - to access the Zabbix web interface.
- TCP port 10051 - to communicate between the Zabbix server and the Zabbix agents for active checks.
We connect to the server on which Zabbix is planned to be installed.
Now it is necessary to create networks for your services.
We create a network for Traefik using the command:
docker network create traefik-network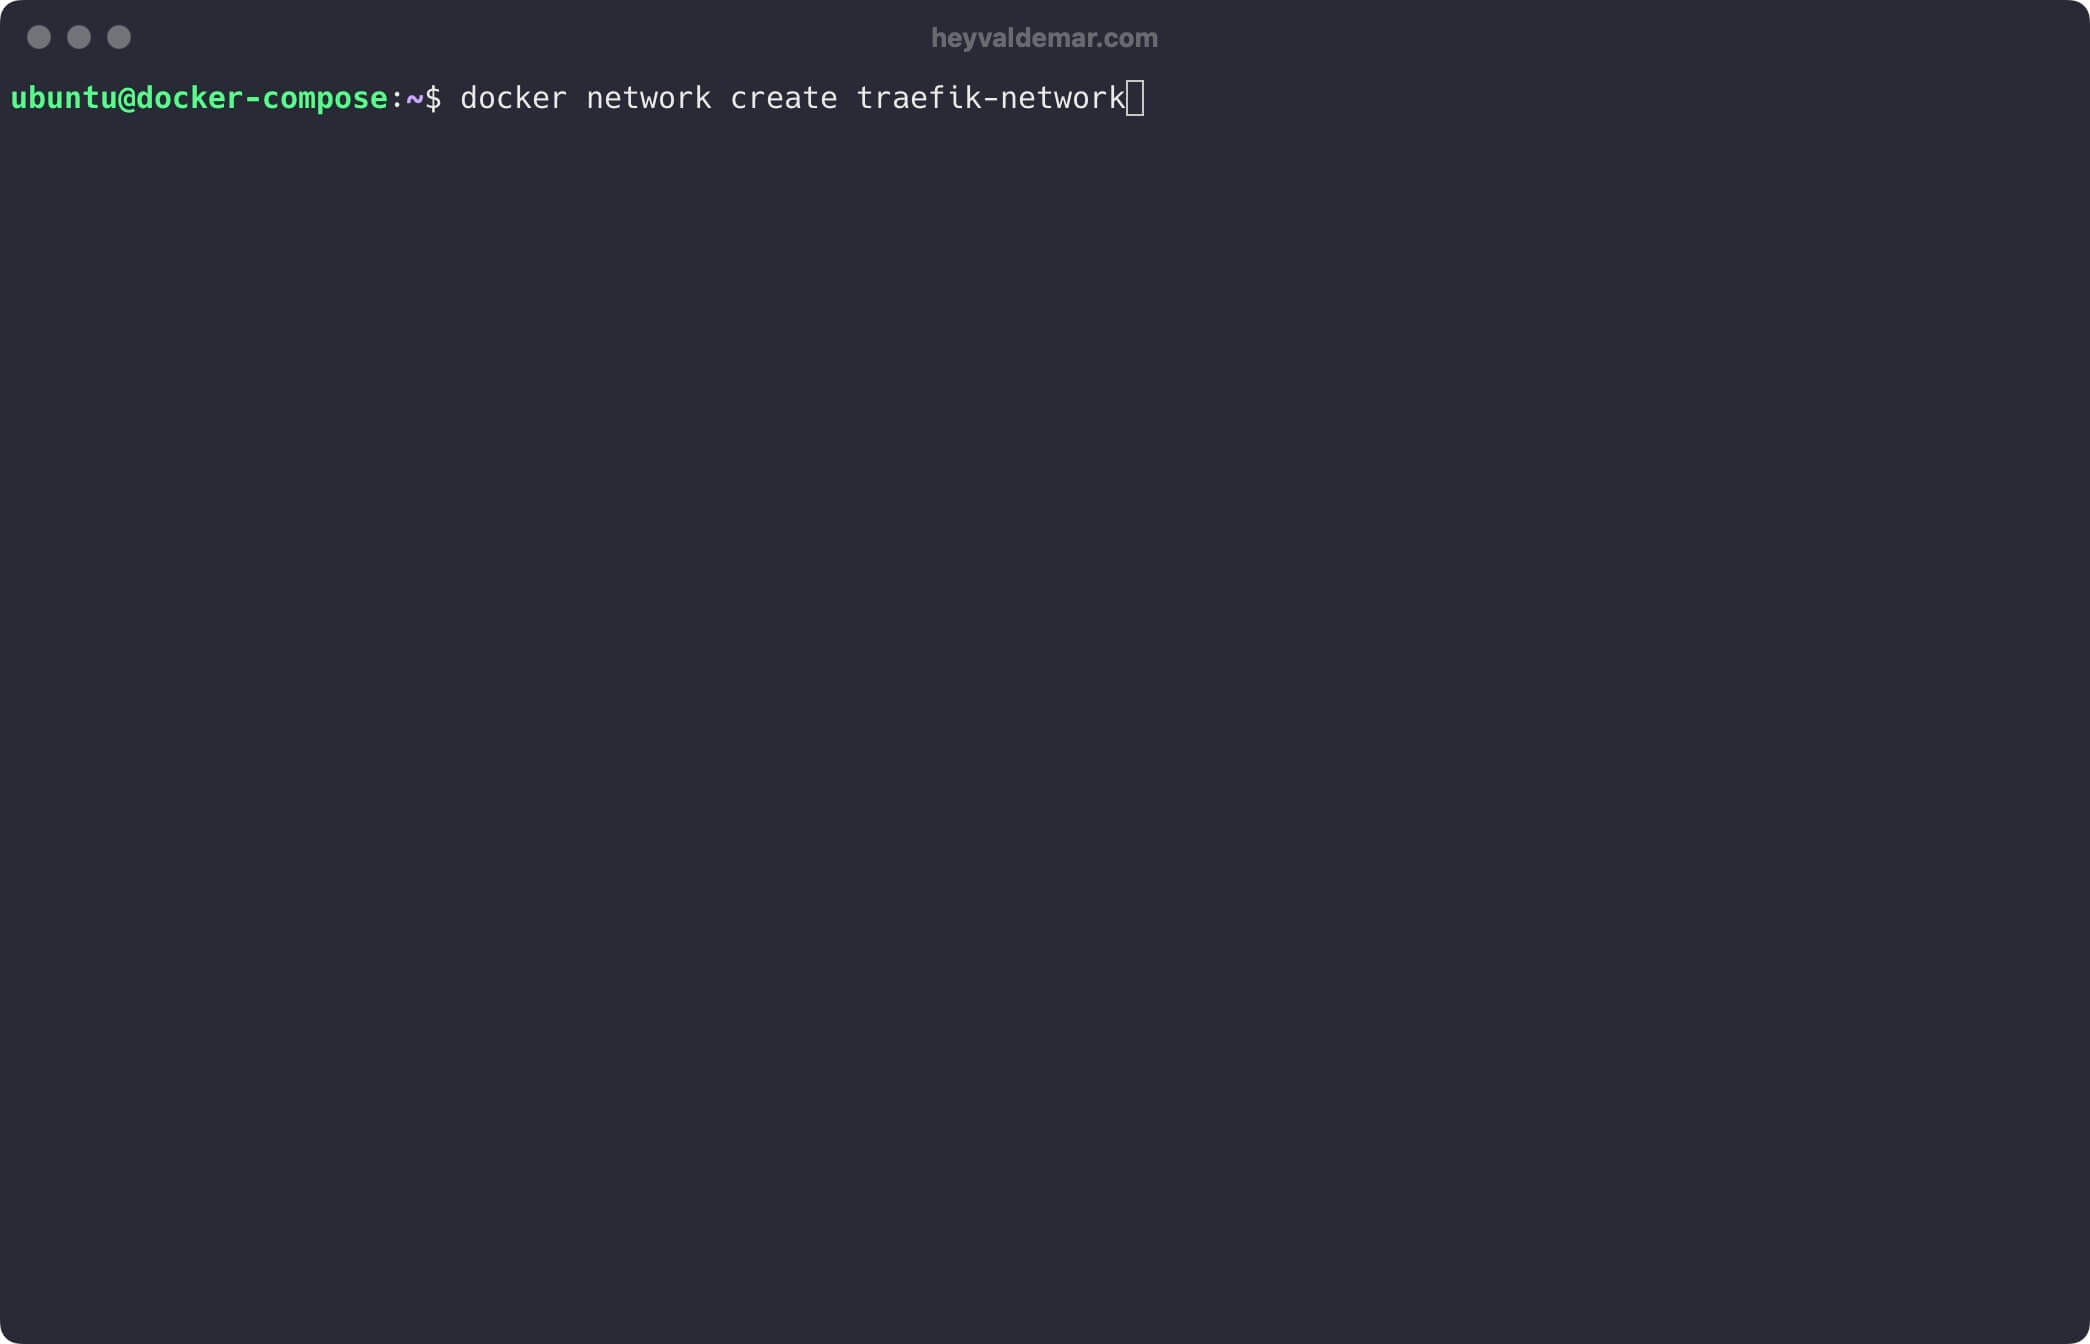
We create a network for Zabbix using the command:
docker network create zabbix-network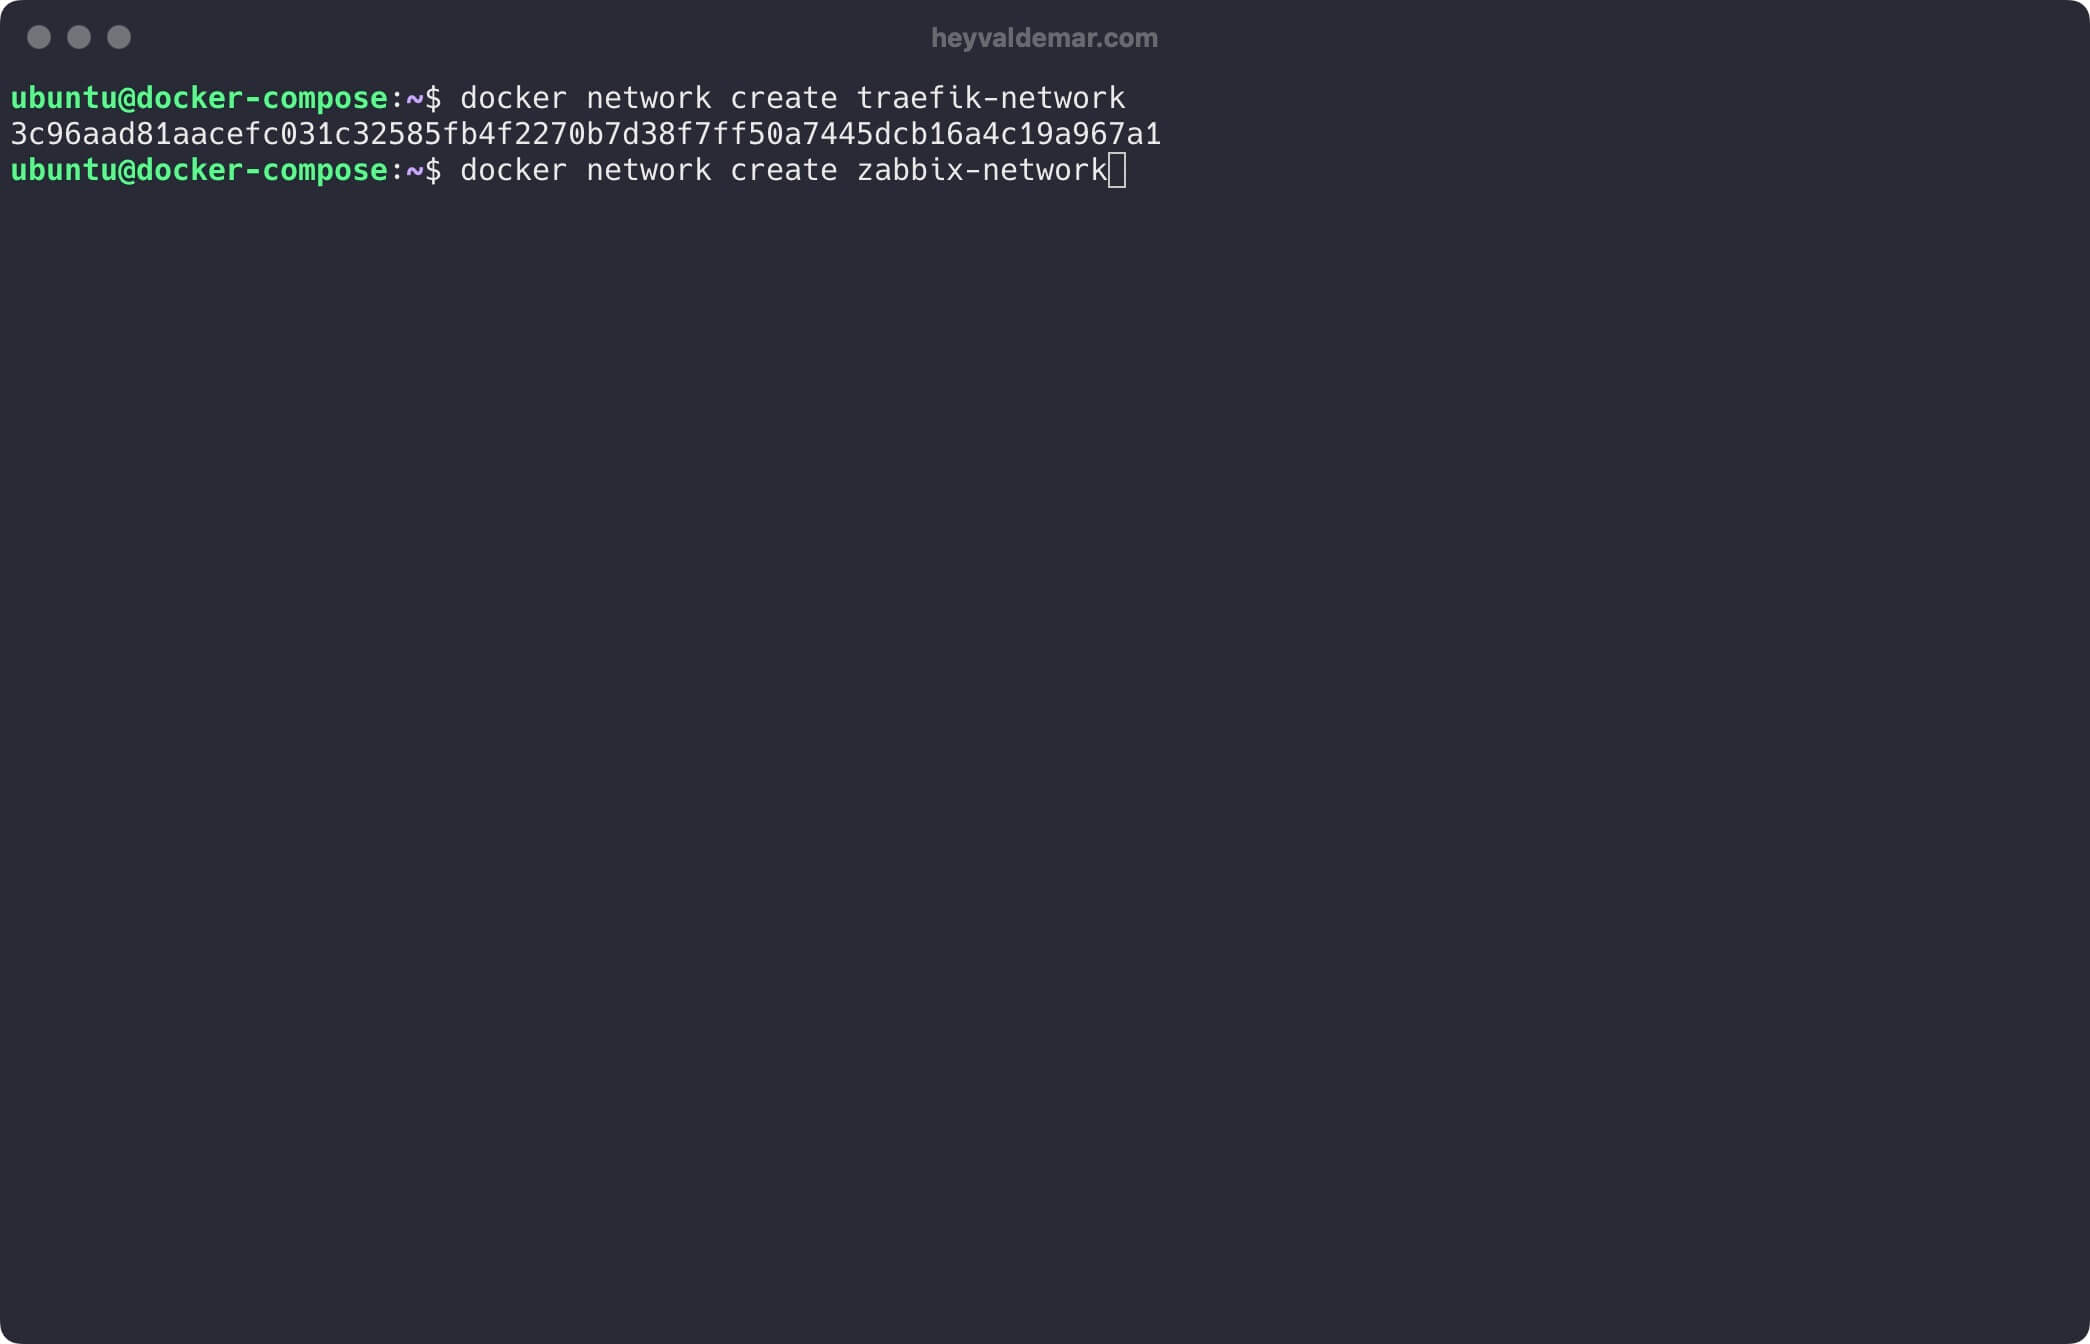
Next, you need to clone the repository that contains the configuration files, which include all the necessary conditions for Zabbix to work.
You can clone the repository using the command:
git clone https://github.com/heyValdemar/zabbix-traefik-letsencrypt-docker-compose.git
Navigate to the directory with the repository using the command:
cd zabbix-traefik-letsencrypt-docker-compose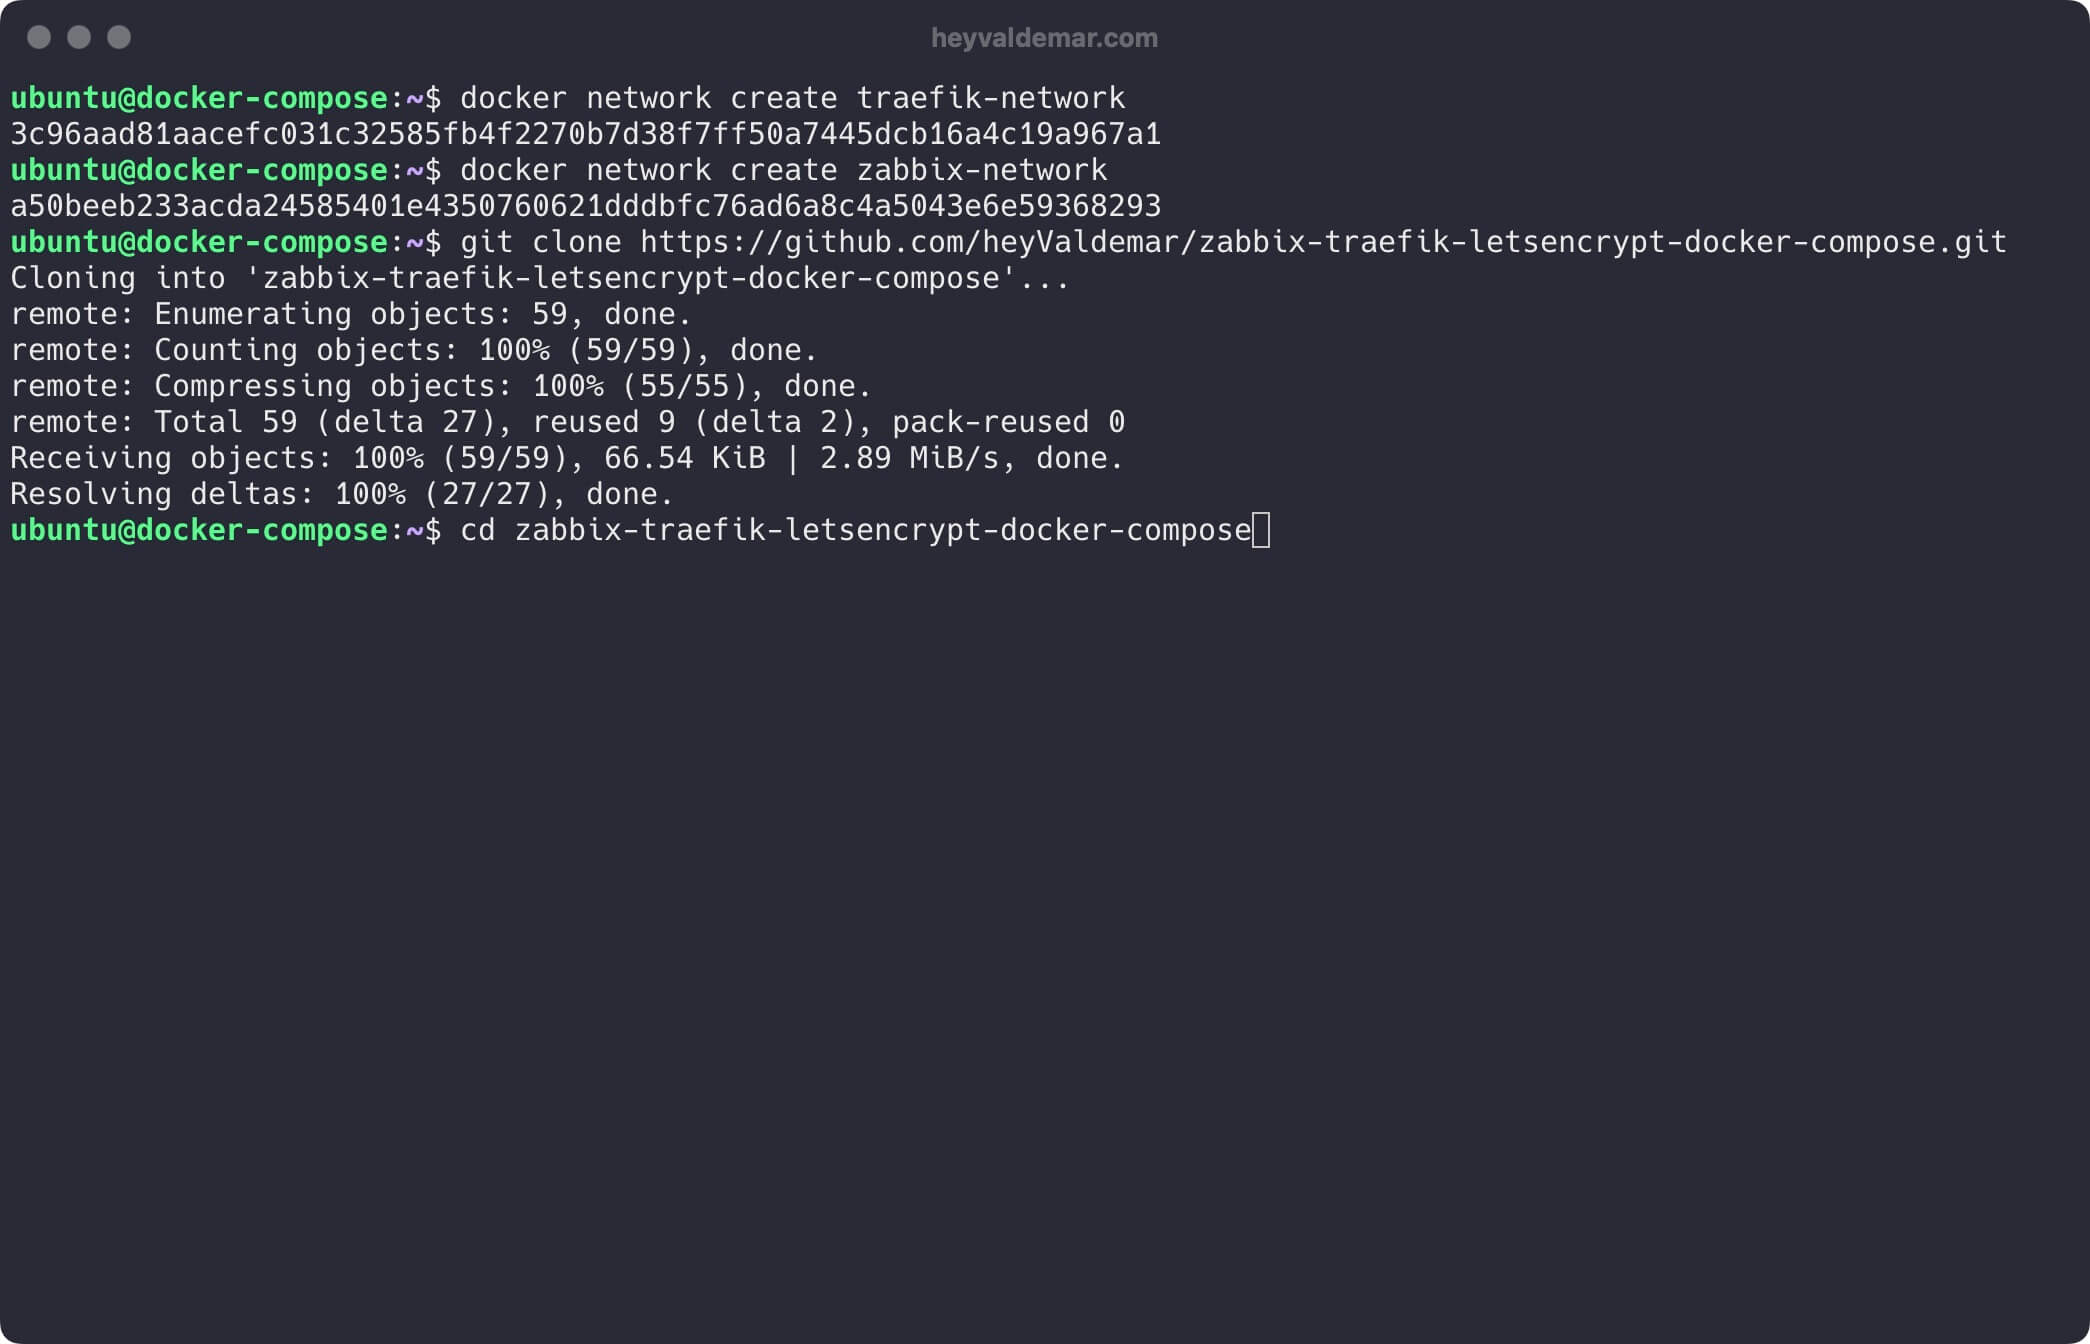
Next, you need to change the variables in the .env file according to your requirements.
💡 Note that the .env file should be in the same directory as zabbix-traefik-letsencrypt-docker-compose.yml.
Now let’s start Zabbix with the command:
docker compose -f zabbix-traefik-letsencrypt-docker-compose.yml -p zabbix up -d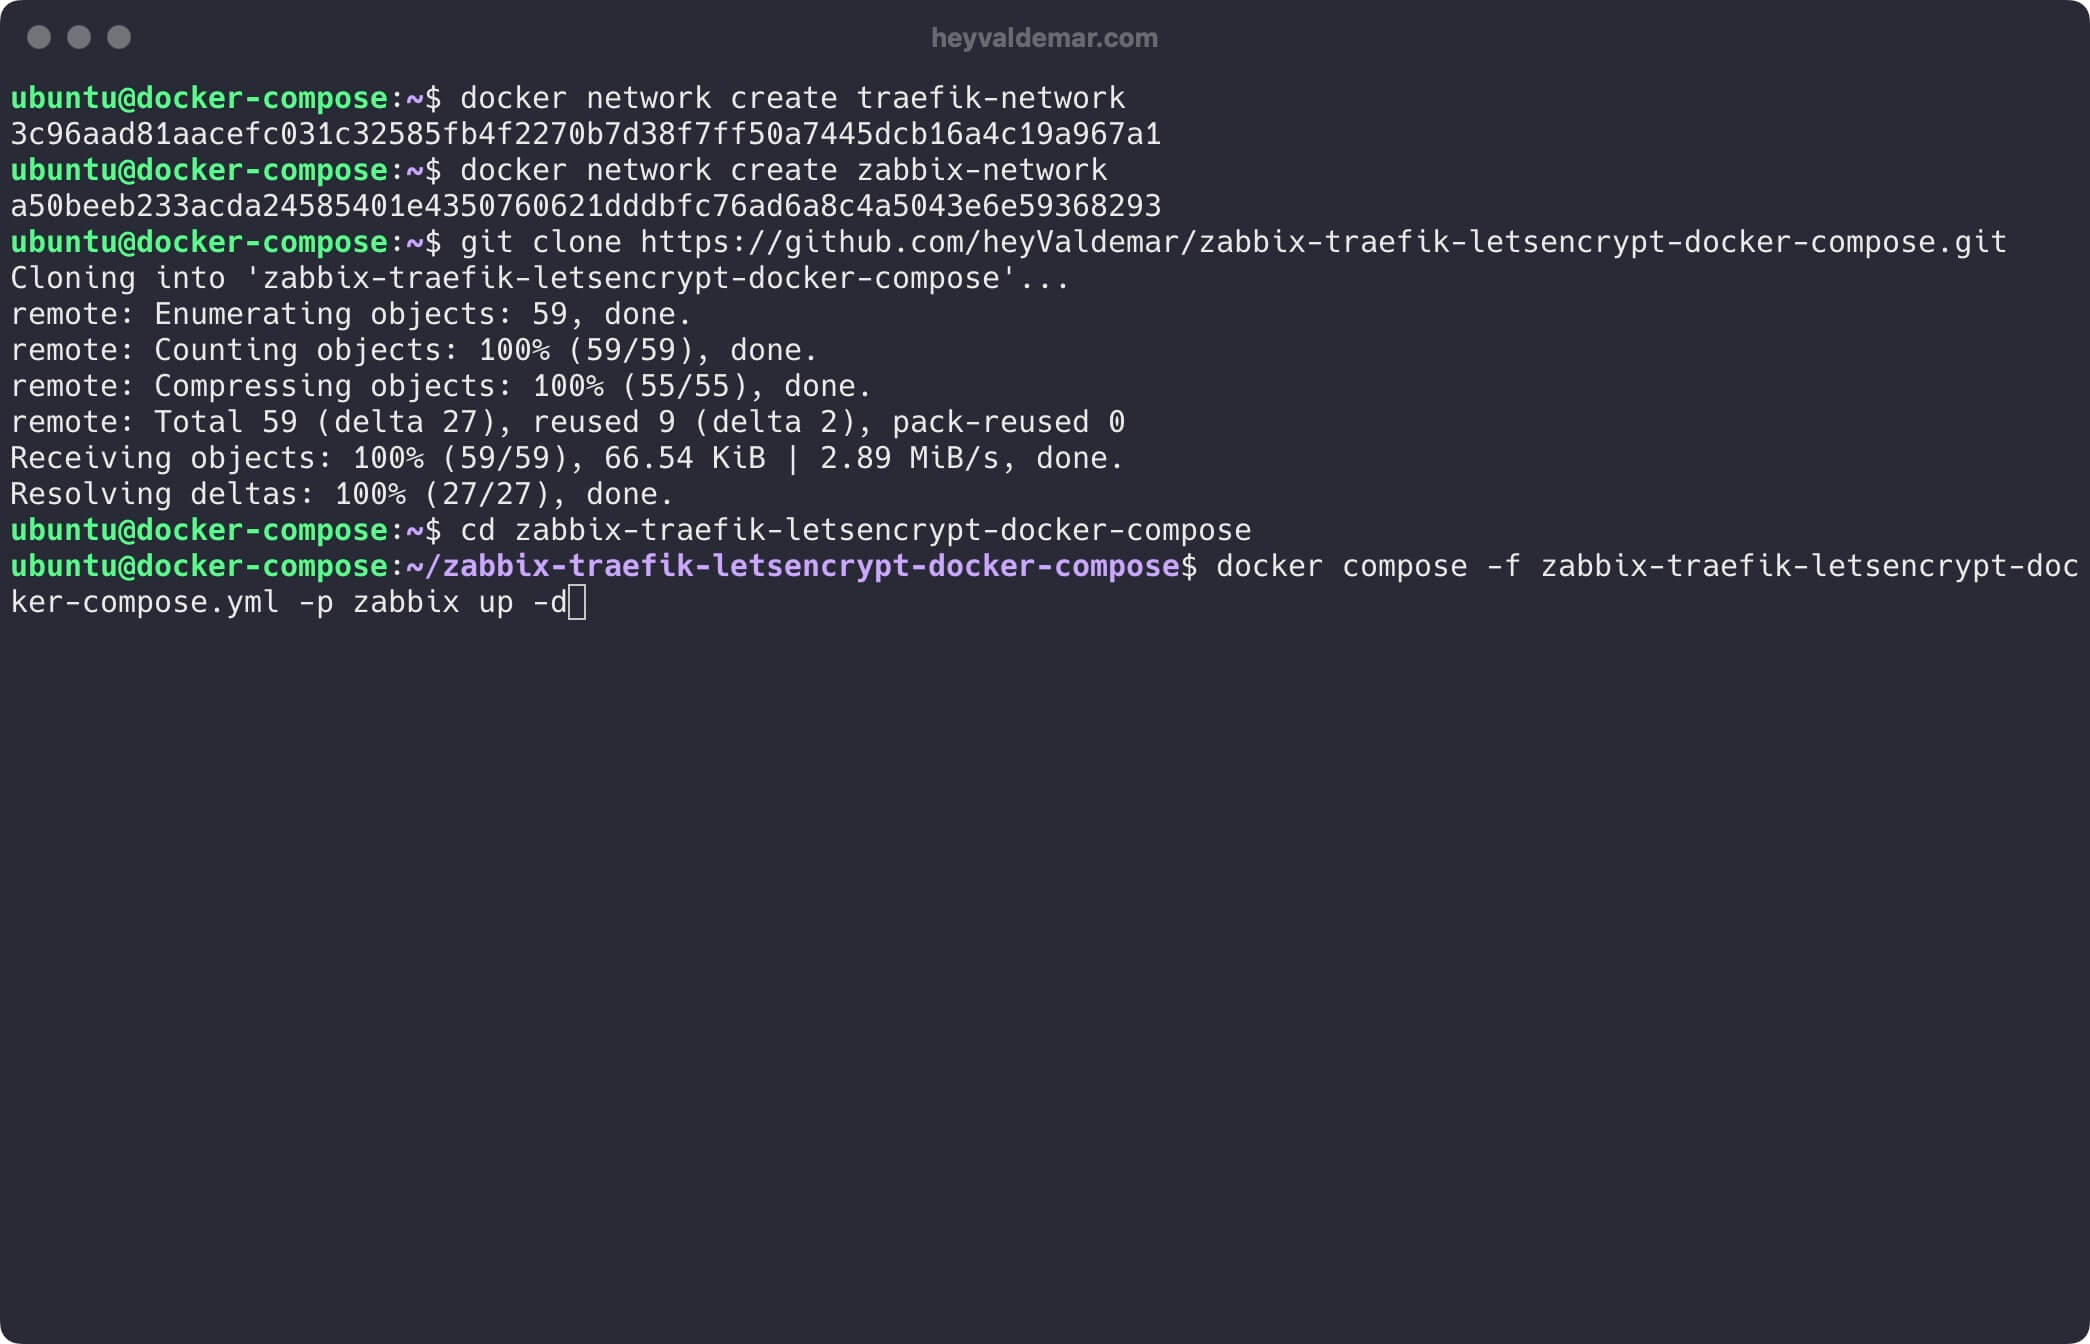
To access the Zabbix management panel, go to https://dashboard.zabbix.heyvaldemar.net from your workstation, where dashboard.zabbix.heyvaldemar.net is the domain name of my service. Accordingly, you need to specify your domain name that points to the IP address of your server with the installed Traefik service, which will redirect the request to Zabbix.
💡 Note that you need to specify the domain name of the service, previously defined in the .env file.
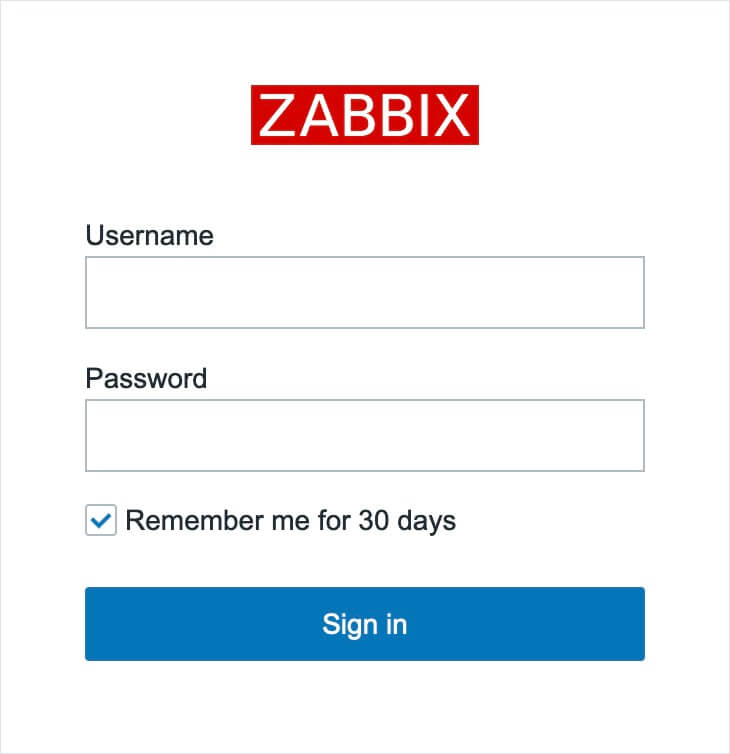
Now, you can log into the Zabbix dashboard as an administrator.
Use the following default credentials for the Zabbix administrator account:
- Username: Admin
- Password: zabbix
Click on the “Sign in” button.
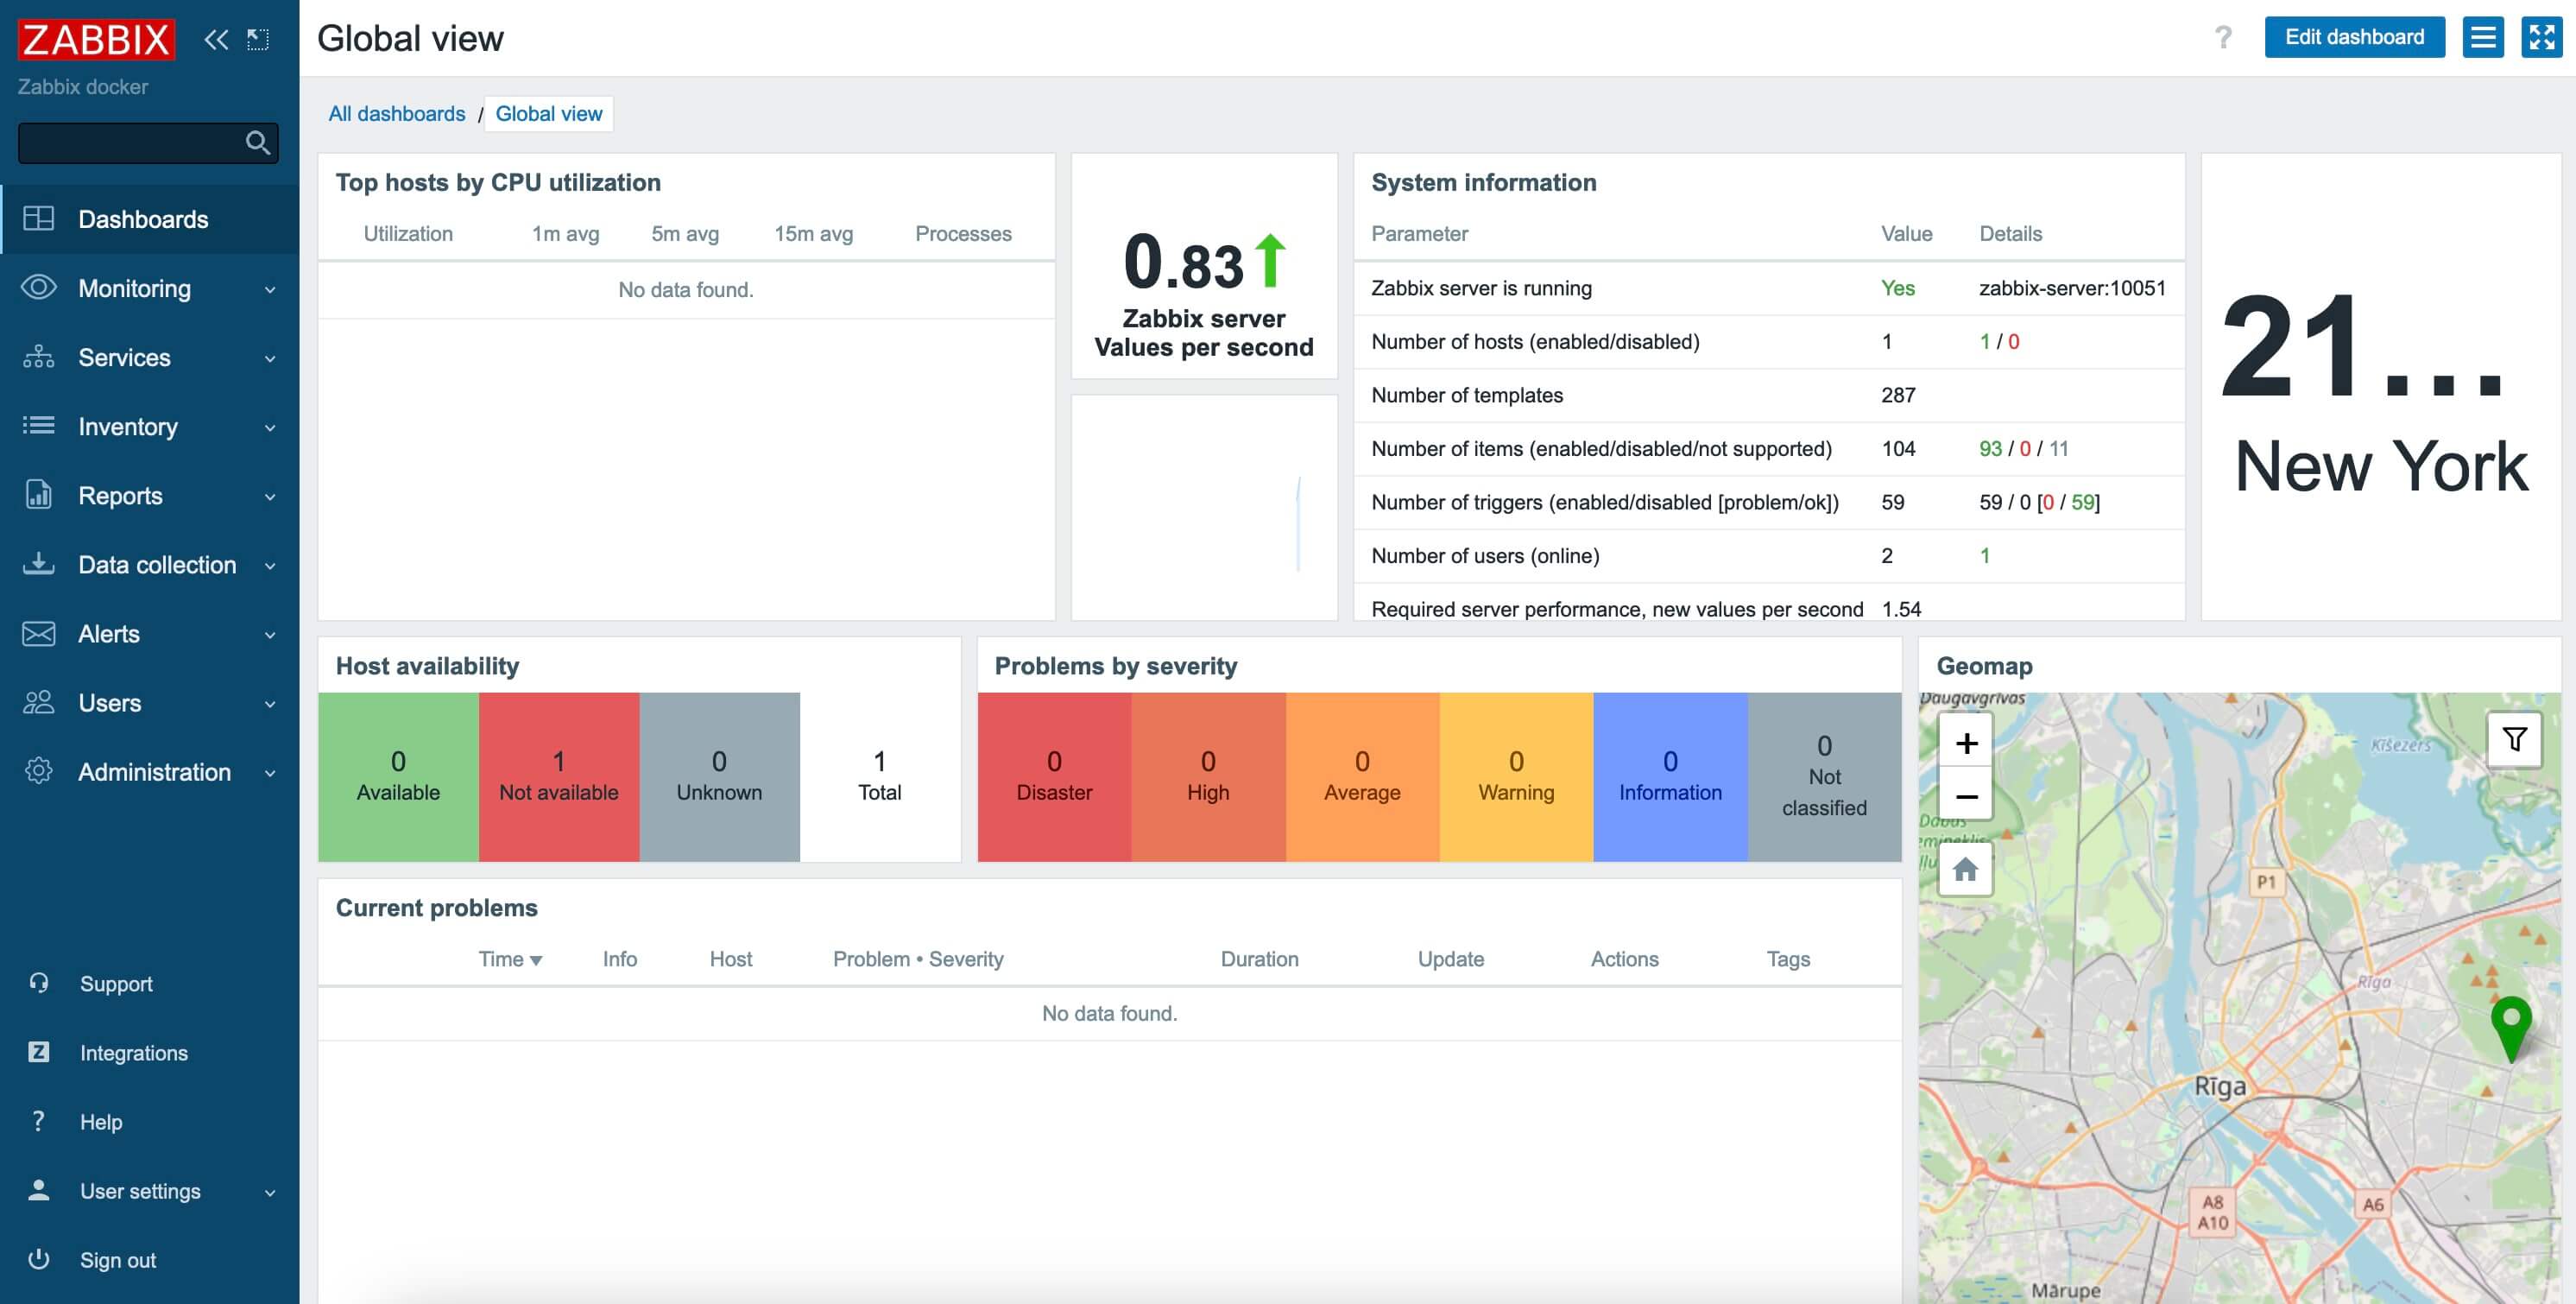
Welcome to the Zabbix control panel.
Next, to configure the Zabbix server for self-monitoring, we need to define the DNS name of the Zabbix Agent.
Proceed by selecting “Hosts” under the “Data collection” section.
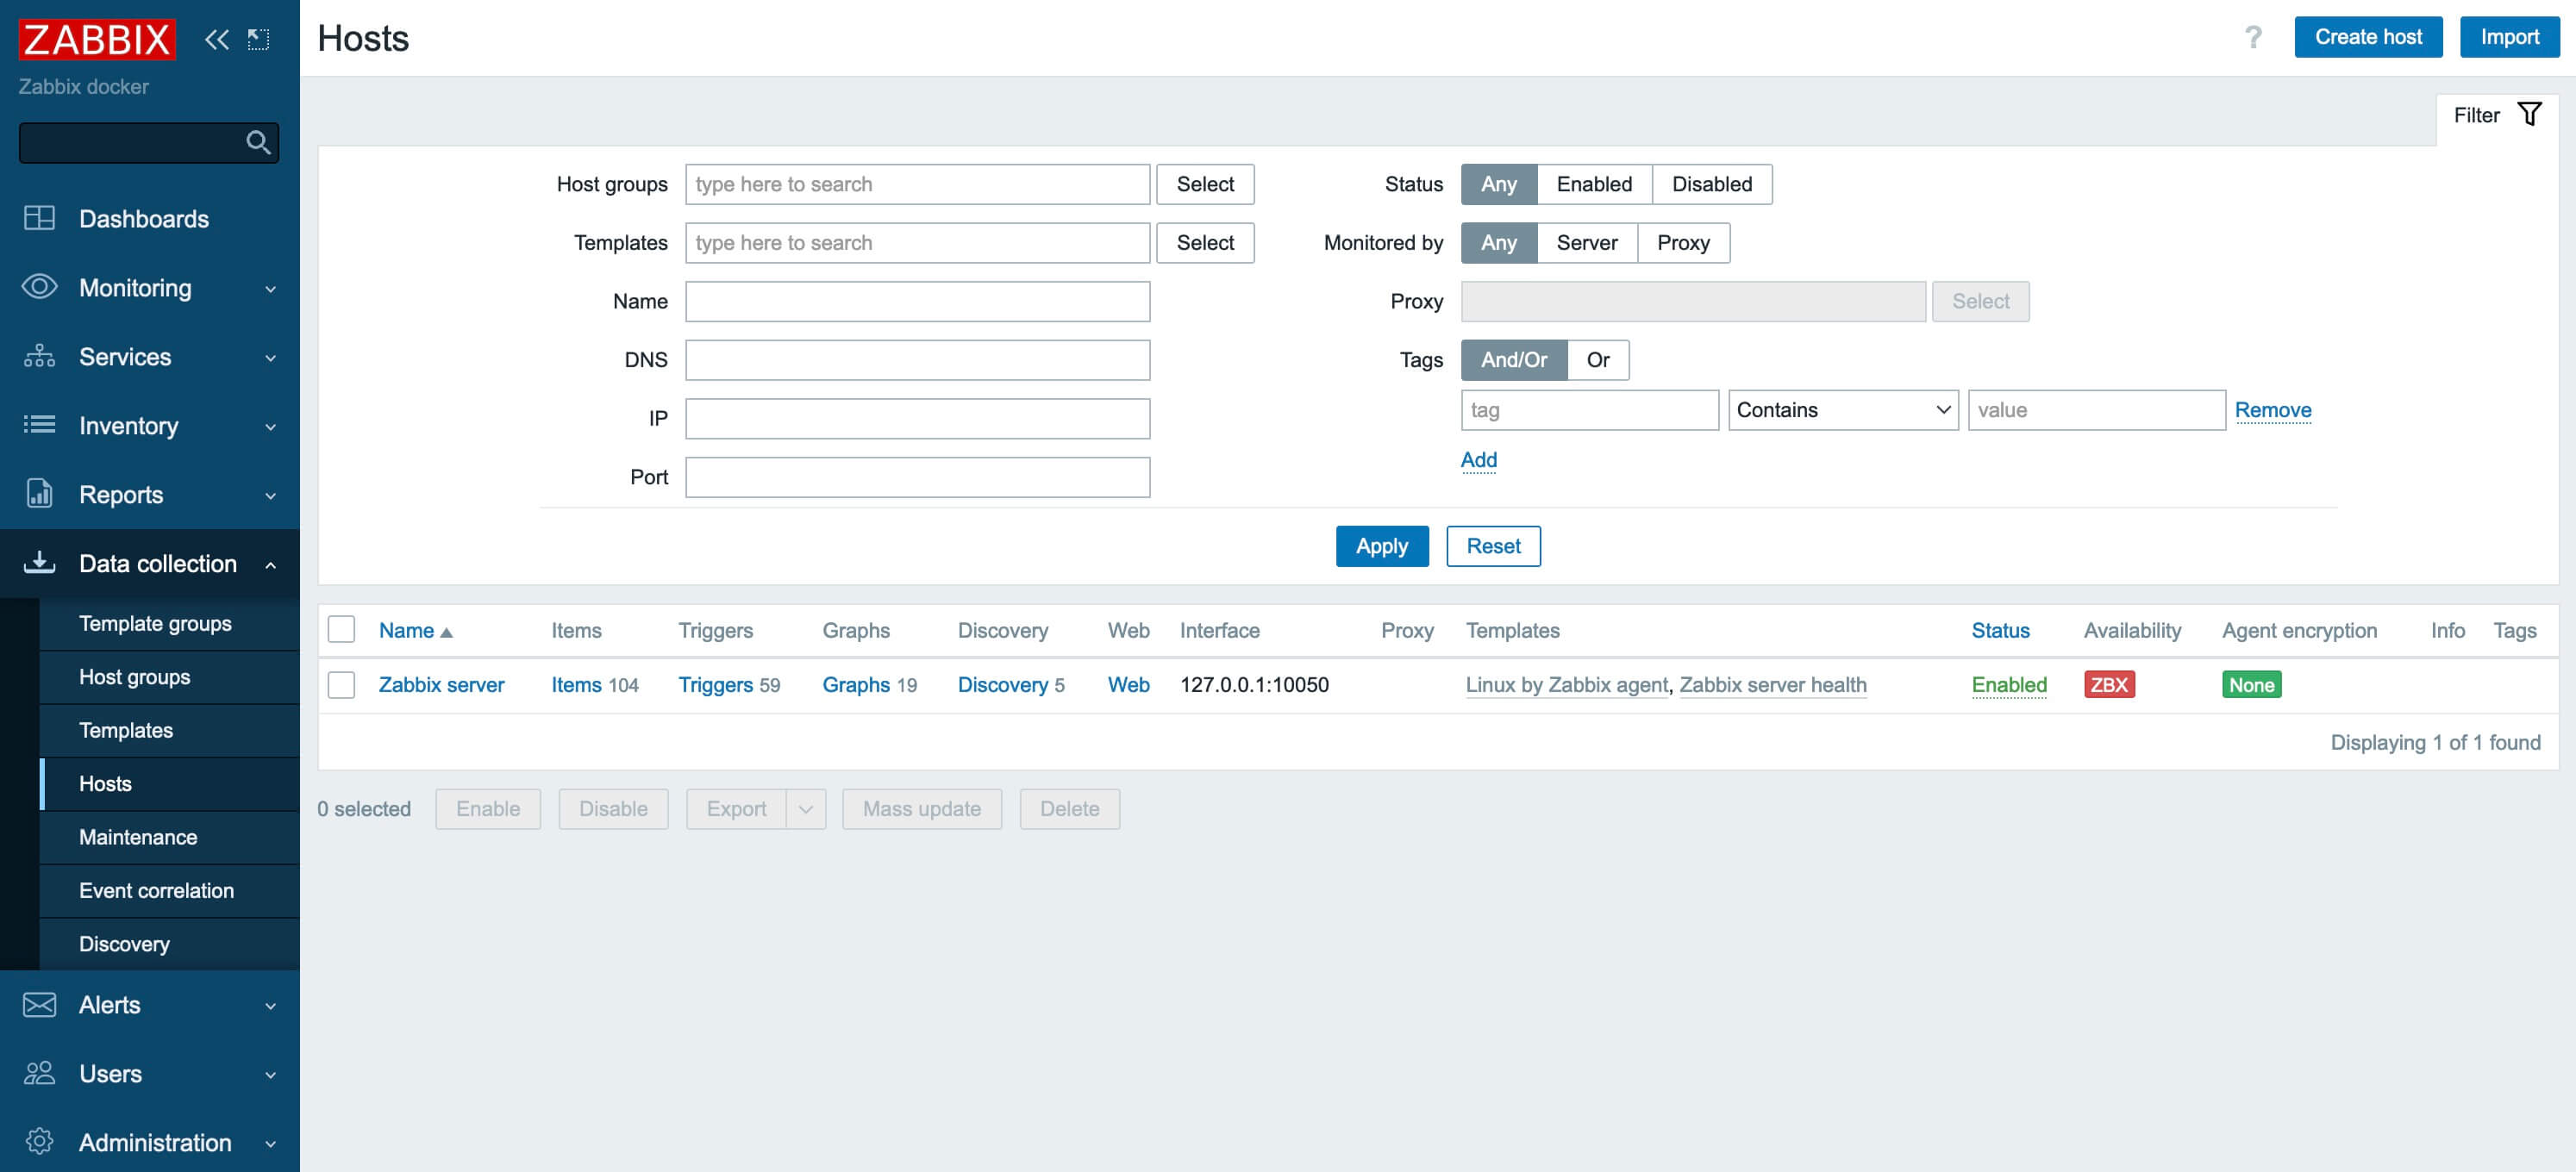
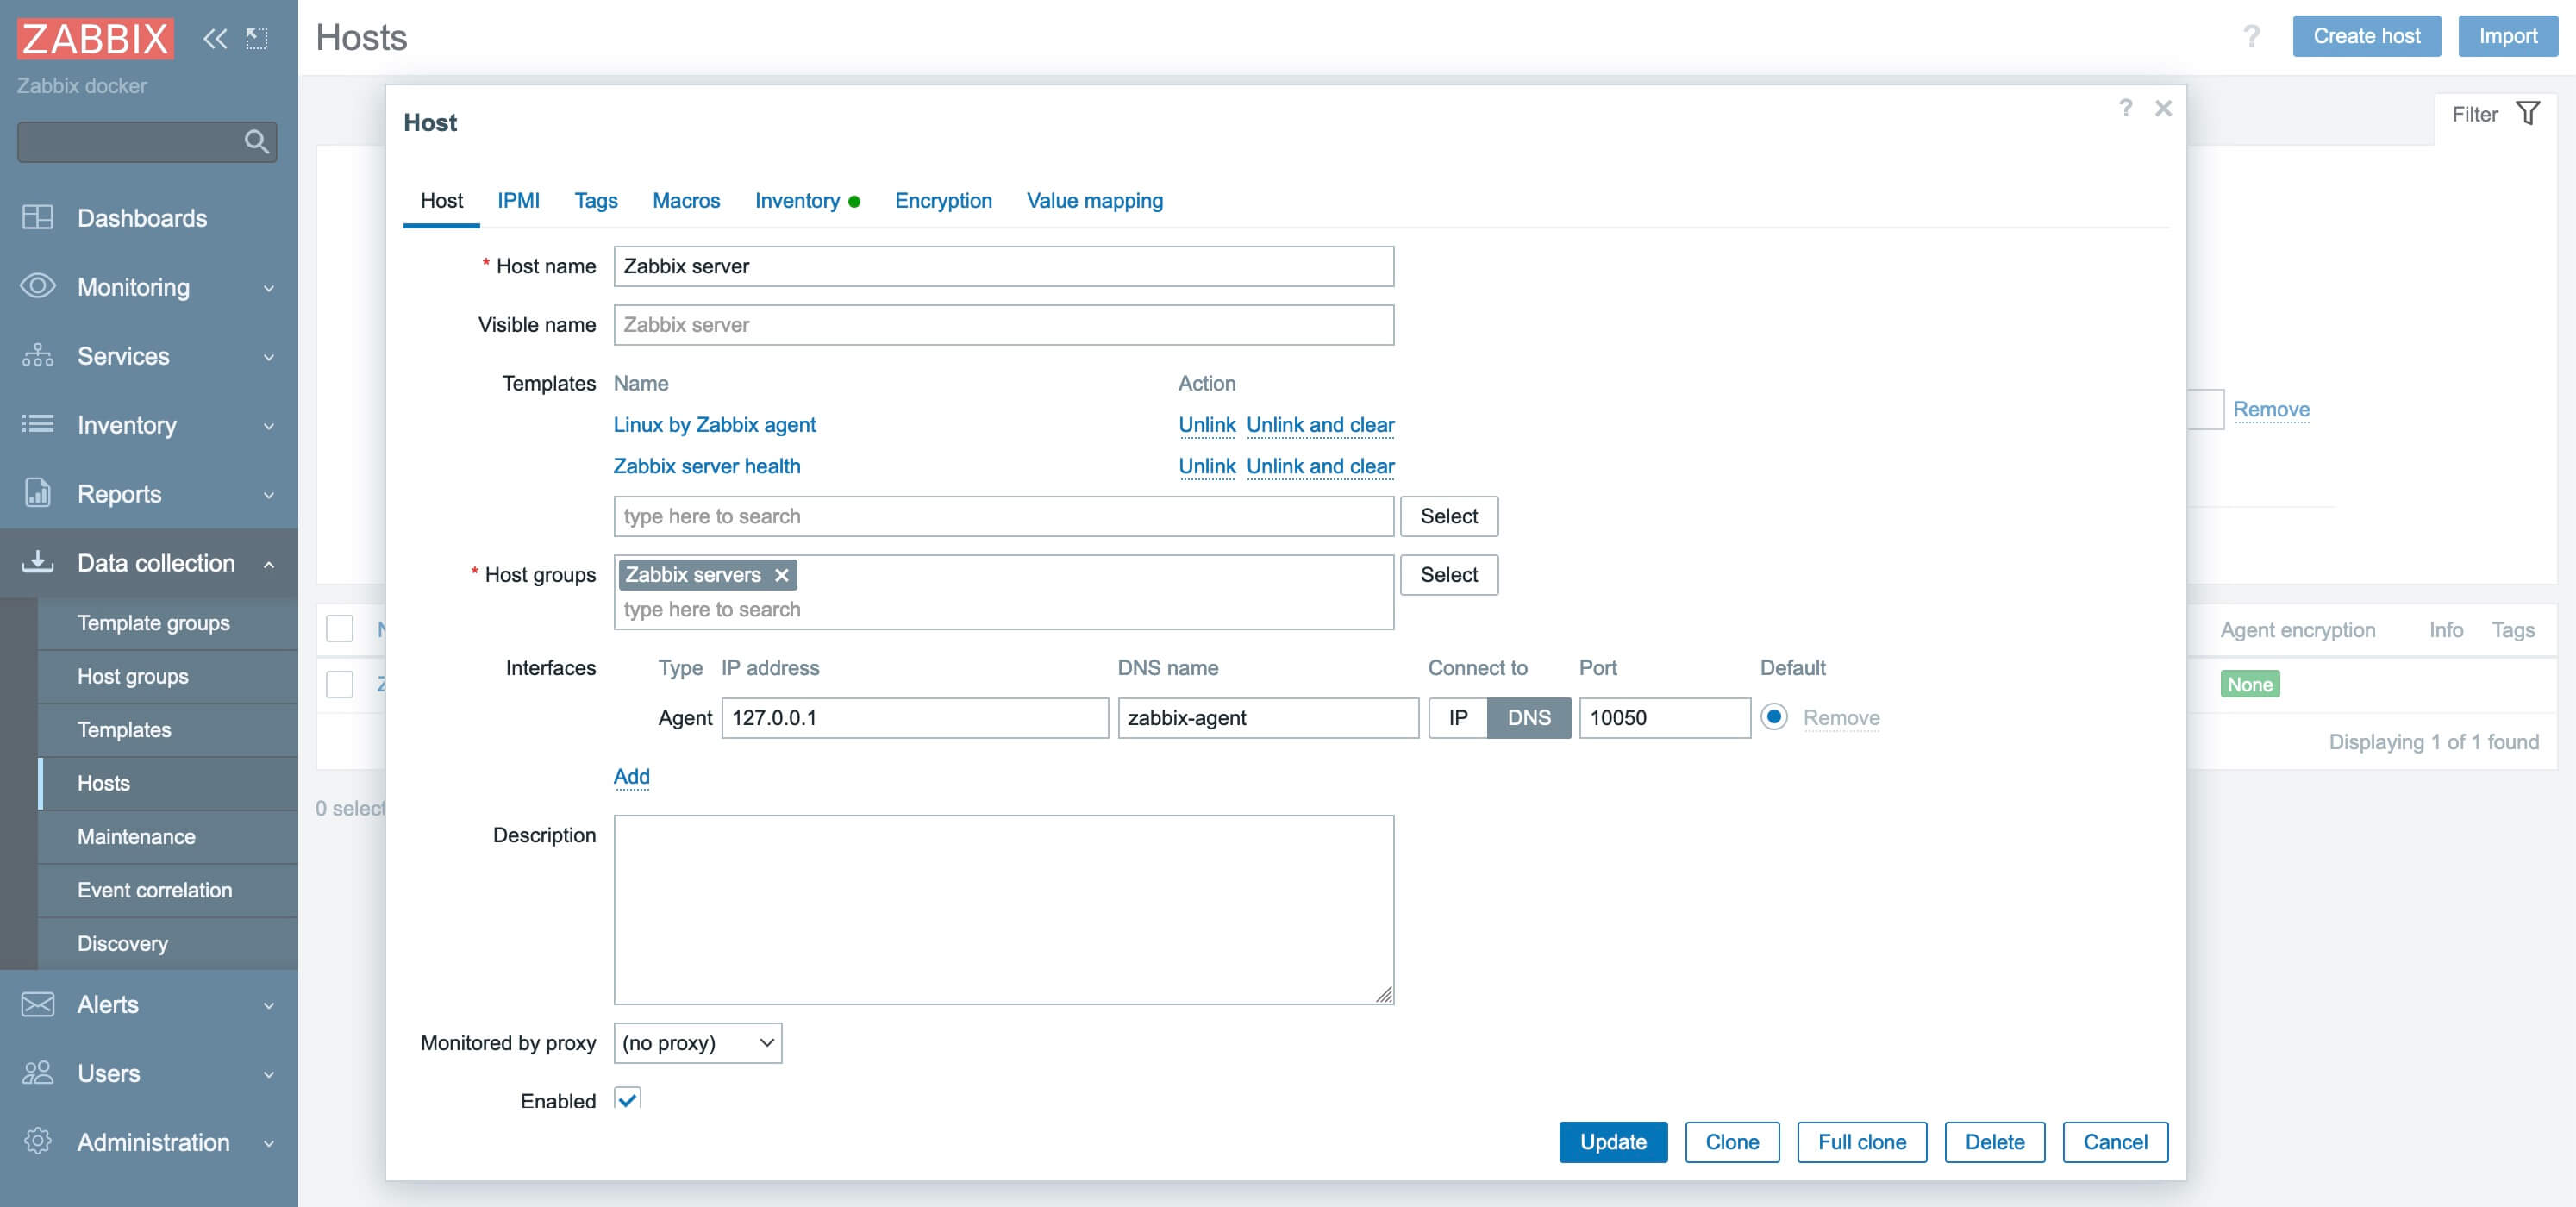
Next, click on the “Zabbix server”.

Within the “Interfaces” section, find the “DNS name” subsection. Enter “zabbix-agent” as the Zabbix Agent service name, referencing the yml configuration file.
Next, under the “Connect to” section, select “DNS”.
Click on the “Update” button.
After waiting a few minutes, refresh the page. You should then observe that the availability status of the Zabbix Agent has turned green.

To access the Traefik control panel, go to https://traefik.zabbix.heyvaldemar.net from your workstation, where traefik.zabbix.heyvaldemar.net is the domain name of my service. Accordingly, you need to specify your domain name that points to the IP address of your server with the installed Traefik.
💡 Note that you need to specify the domain name of the service, previously defined in the .env file.
Enter the username and password previously set in the .env file, and click the “OK” button.

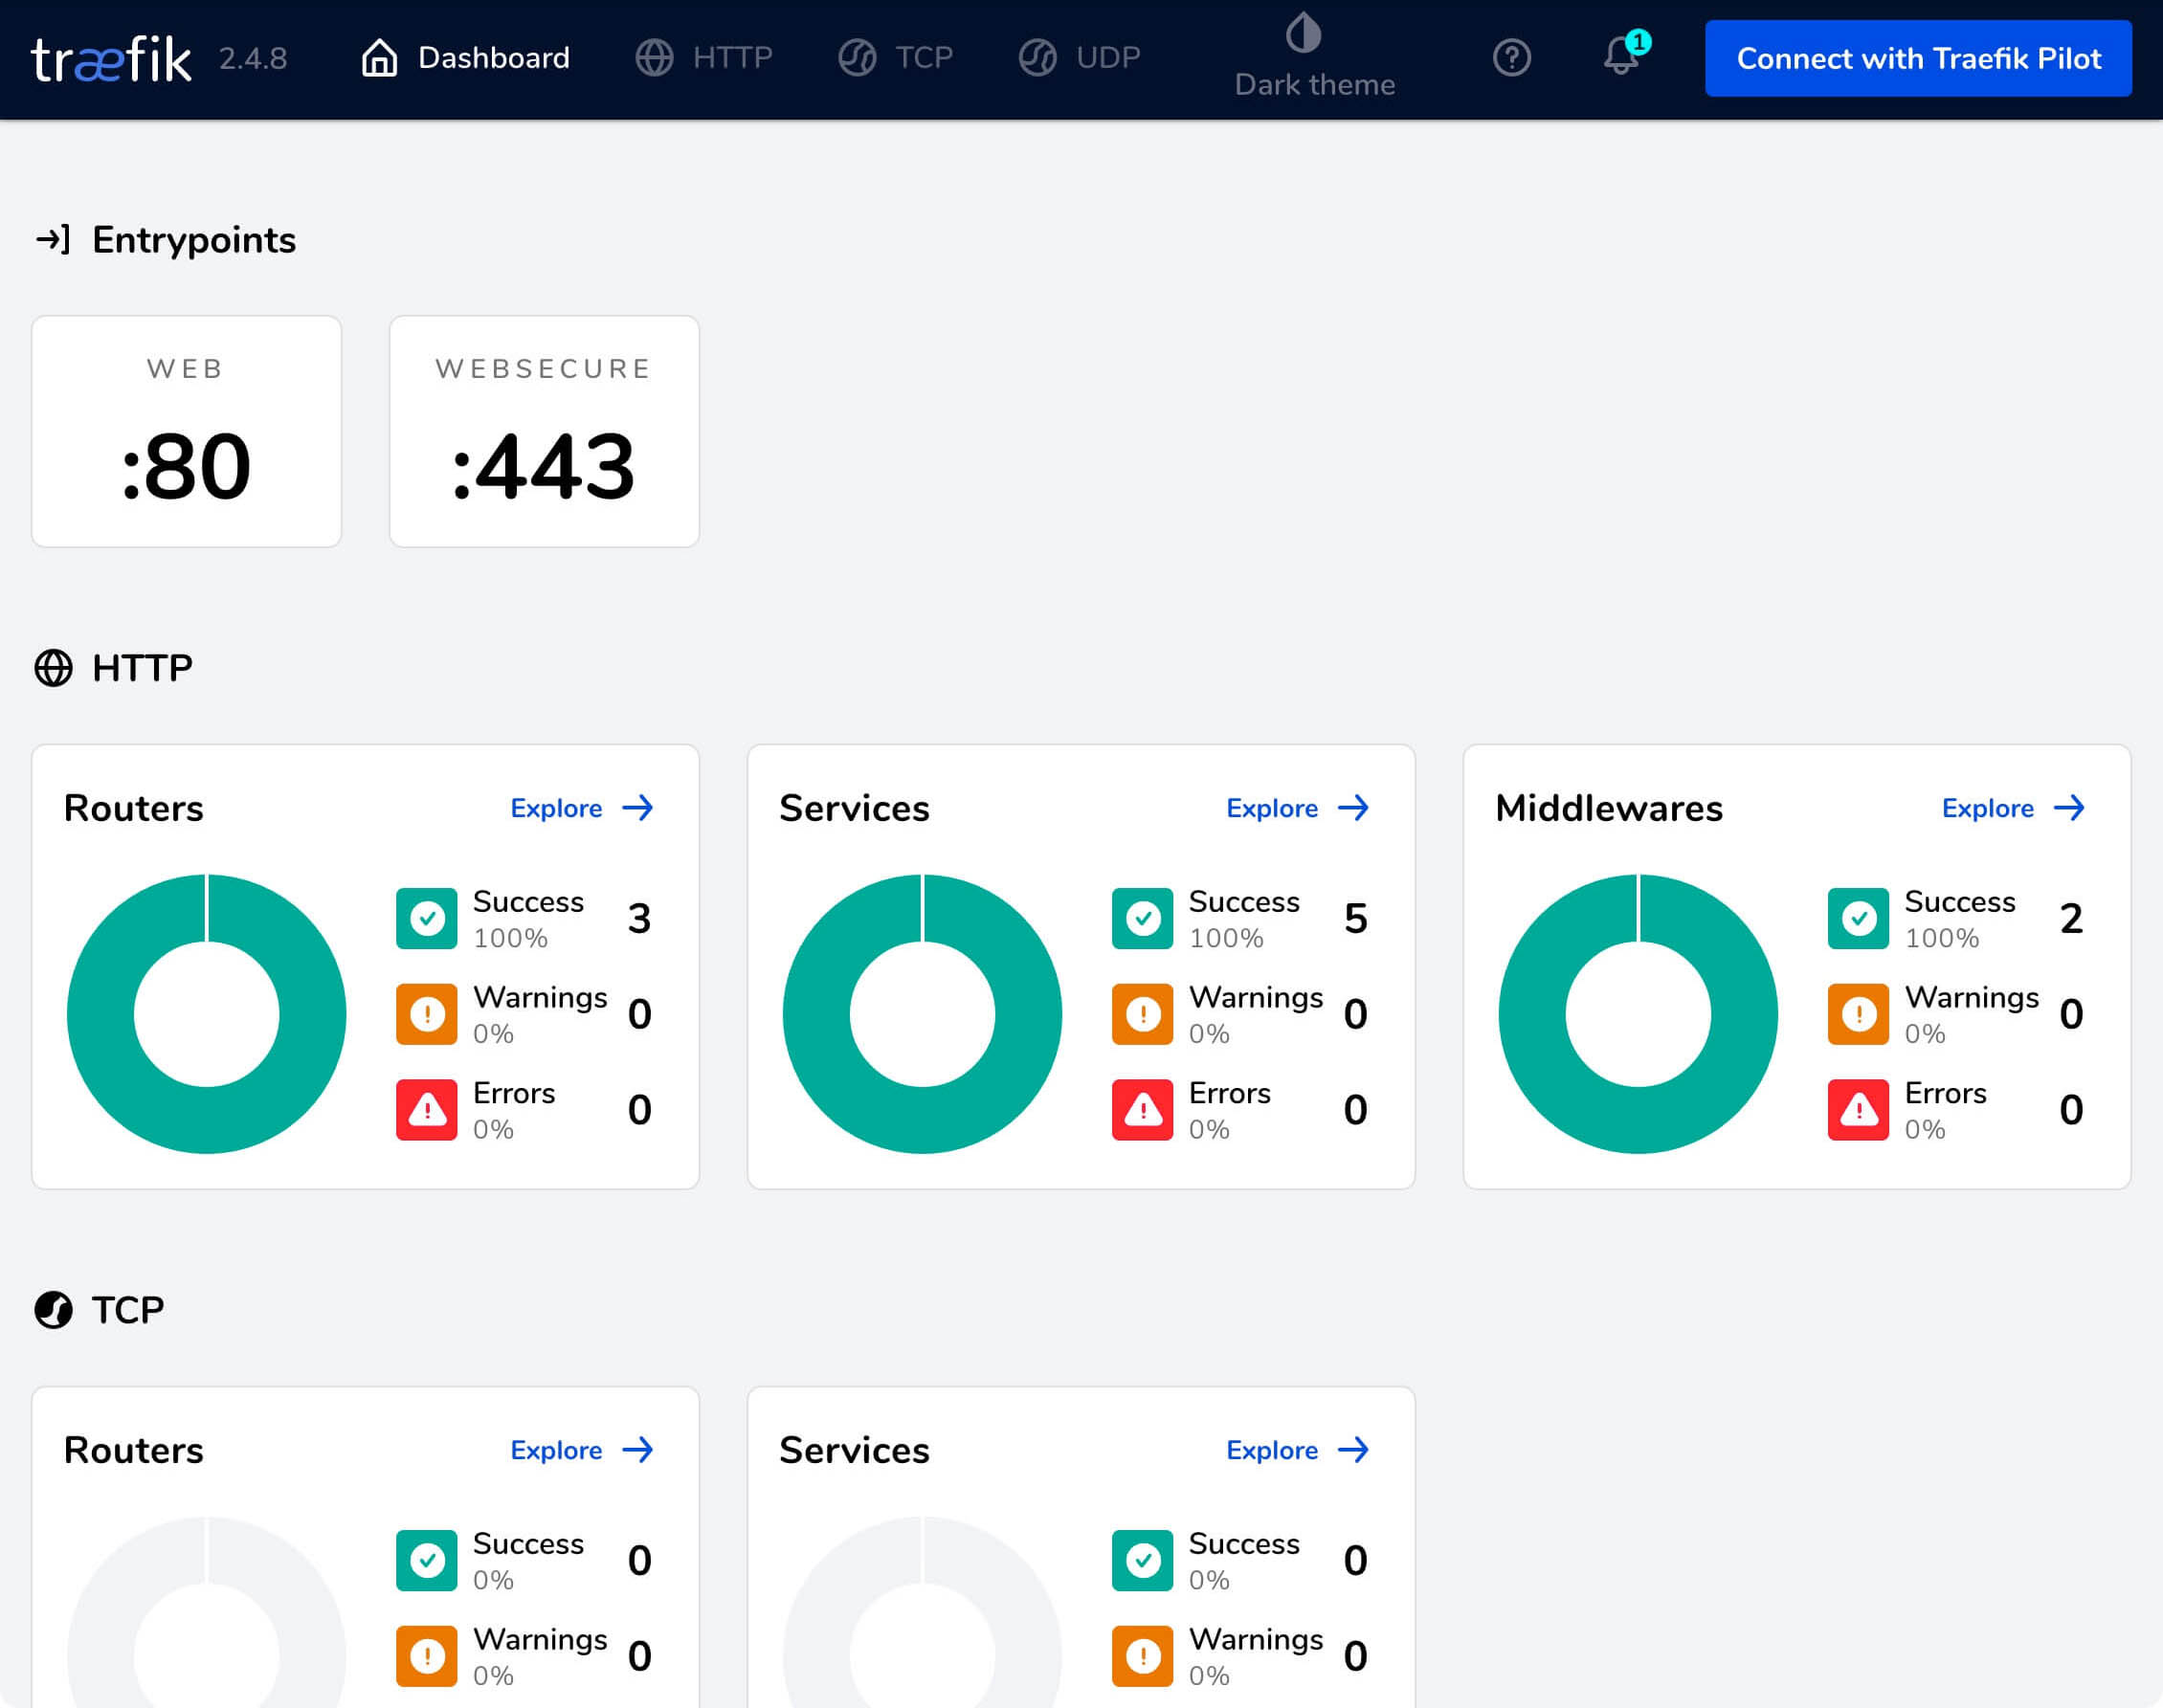
Welcome to the Traefik control panel.
My Courses
🎓 Dive into my comprehensive IT courses designed for enthusiasts and professionals alike. Whether you’re looking to master Docker, conquer Kubernetes, or advance your DevOps skills, my courses provide a structured pathway to enhancing your technical prowess.
My Services
💼 Take a look at my service catalog and find out how we can make your technological life better. Whether it’s increasing the efficiency of your IT infrastructure, advancing your career, or expanding your technological horizons — I’m here to help you achieve your goals. From DevOps transformations to building gaming computers — let’s make your technology unparalleled!
Refill My Coffee Supplies
💖 PayPal
🏆 Patreon
💎 GitHub
🥤 BuyMeaCoffee
🍪 Ko-fi
Follow Me
🎬 YouTube
🐦 Twitter
🎨 Instagram
🐘 Mastodon
🧵 Threads
🎸 Facebook
🧊 Bluesky
🎥 TikTok
🐈 GitHub
Is this content AI-generated?
Nope! Each article is crafted by me, fueled by a deep passion for Docker and decades of IT expertise. While I employ AI to refine the grammar—ensuring the technical details are conveyed clearly—the insights, strategies, and guidance are purely my own. This approach may occasionally activate AI detectors, but you can be certain that the underlying knowledge and experiences are authentically mine.
